
Lets get started and design a Sales report in Power Bi. I have used Dynamic 365 Finance and operation data entities as the data source, you can use any other mode of data as per your requirement.
Below are the steps for getting data and designing data in a report format
For connecting your D365 data source to Power bi, first move to your power bi desktop and specify dynamics url concatenated with “/data”.


Click connect

Make a connection by signing in after making a connection you will be able to access all the dynamics 365 finance and operation entities , you can choose multiple which you need in your report. The preview of the data will be available of the choosen data source.

There is two option to load, transform or cancel data.
You can choose load data to exact load all the data.
You can choose transform data when you want to apply filters to your data source.
Let’s get ahead, and design a report .. As in the above steps you have made the connection to the data source , now let’s design the Data in the understandable format.
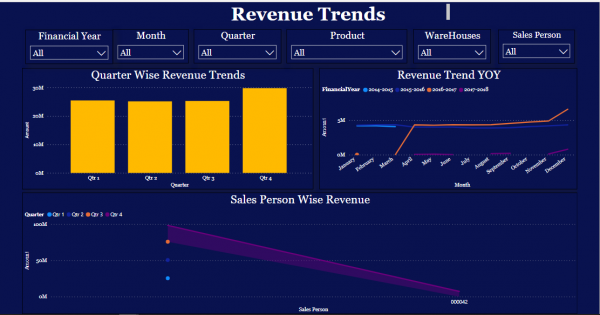
Below is the Revenue Trend Report ..


Above highlighted data sources are used to design above report.
These are the data entities of D365 finance and operation.
Let’s divide the report in two parts filters and dashboards visual.
Firstly we will work on the filters as in dashboard we are using all the filters .
Filters
- Financial Year :

As above, all the financial year are visible in the filter.
This filter is designed on the basis of the date. For doing so, we have created a custom column in which data is filtering on the calculation defined.
Move to your data source and right click on new column option highlighted below.

Below highlighted window will appear.

As you can see, you can filter data, you can change type and you can write your custom code that will appear in that column.
I have named the column to financial year.
Below is the query I have used.
IF(MONTH([Date])>3,YEAR([Date])&”-“&YEAR([Date])+1,YEAR([Date])-1&”-“&YEAR([date]))
Syntax: If(condition, true, false)
In the above calc. we have return ( current year – next year) when the month is greater then three else return (previous year – current year)
After creating column click on new visual and change its visualization to slicer, highlighted below.

In the field select your required field i.e. financial year.

By default it is in list format to make it dropdown , click on the arrrow highlighted on the right side of the design, as shown below .

Select dropdown.

It will be modified as above.
for changing its visualization i.e. its color, background, font etc. Walk through the visualization section, as shown below.

Final output :

For creating rest of the filters you just need to assigned fields.
Dashboards:
1.Quarter wise revenue trends:

The above data basically shows the quarter wise Amount of sale.
For designing this follow below mentioned steps.
- First select new visual as bar chart.

As we need data quarterly, we will add quarter to the axis.
Note: Date in Bi are stored in hierarchy format. You can get year quarter month and day.

After adding quarter add your value, I have used line Amount field of Sales Invoice line entity.

For changing labels and formatting design, walk through visualization as shown below.
2. Revenue trend YOY

This report basically gives revenue month wise and as per financial year.
For creating this follow below steps.
- Firstly select new visual and then select line chart.

For Axis add month , and financial year at legend and line amount at value

For changing labels and formatting design, Walk through the visualization section, as shown below.
3. Sales Person Wise Revenue

This report basically gives over view of sales person wise quarter wise revenue generated.
For creating so follow the below mention steps.
- Firstly select new visual and select Stacked Area Chart.

Add Sales person to axis, quarter to legend, line amount to values.

For changing labels and formatting design, walk through the visualization section, as shown below.
Note: Enabled cross report filtering to filter all the report as per the filter.

Hope the above helped you out in designing the report and getting started to Power BI. If there any queries feel free to contact us and comment below.
You can also let us know with what you want next in power bi, we will try level best to do so.
For post like this visit our facebook Page and YouTube channel.